Lecture 1-1: Potential Data Pitfalls
AI for Decision Makers: Data Architecture
Abstract
Opening segment of the Data Architecture module (9:30 to 9:45, 15 minutes). Where data stacks actually break, using the Dunder Mifflin Paper Company data as the running example. Covers single source of truth, key drift, format chaos, duplicates, lineage, and bus factor, then hands the room to a pairs and trios reflection on where these pitfalls show up in their own work.
Learning Objectives
Today’s Objectives
What You’ll Leave With
By the end of this segment, you will be able to:
- Name the six places a data stack usually breaks, using concrete symptoms rather than vague complaints.
- Explain what a single source of truth is, and identify one place yours is violated.
- Define data lineage and say why it is the first thing to ask for when a metric looks wrong.
- Diagnose a reporting problem by starting from the business question instead of the data you happen to have.
. . .
Module Connection: This serves Module Objective 1, communicating about pipeline components, connectivity, and feasibility with your database administrators and IT teams. You are not here to build the pipeline. You are here to describe the problem well enough that someone can.
Fifteen minutes. Do not linger here. The objectives slide is a contract, not a lecture.
The room is manager level. Survey says: mostly Excel, no modeling, want modeling. They are not going to write a pipeline this morning. They are going to task someone else with one. Frame everything as “how do I describe this to IT without wasting their time.”
Part 1: The 9:15 AM Disagreement
Two numbers. One company. Somebody is about to present the wrong one. 🐢
Scranton Q4 Revenue
Same Question, Two Answers
Michael needs one number for the board deck: what did Scranton sell?
The hand-kept tracker
The sheet Michael’s team actually maintains. 155 rows, updated by hand, lives on somebody’s desktop.
Total: $43,020.24
The system of record
sales_order_lines, generated from the orders that actually shipped and were invoiced.
Total: a different number.
. . .
Both are “the data.” Both are defended by someone with a job title. Which one goes in the board deck?
Do not resolve this yet. Let it sit. Ask for a show of hands: who has been in a meeting where two people brought different numbers for the same question? Nearly every hand goes up.
The honest answer is that the tracker is wrong, but the point is not “spreadsheets bad.” The point is that nobody in the room can tell which is right by looking. That is the failure.
Look at the Actual Sheet
Six real rows from regional_manager_tracker.csv:
| Date | Client | Rep | Qty | Total $ | Notes |
|---|---|---|---|---|---|
| 01/05/22 | Whitmore Nonprofit Services | 83 | 19 | 249.36 | check w/ Dwight |
| 09/02/22 | Ridgeline Nonprofit Services | 5 | 23 | 365.24 | net-30 |
| 07/07/22 | Cascade Nonprofit Inc | 5 | ~11 |
107.03 | net-30 |
| 06/28/22 | Redwood Financial Goup | 104 | ~8 |
136.40 | net-30 |
| 02/10/22 | Conerstone Retail Associates | 161 | 15 | 230.01 | |
| 12/03/22 | Summi Hospitality Co | 7 | 30 | 634.20 |
. . .
Nothing here is malicious. Every one of these is a person doing their best on a Tuesday.
Walk the table slowly. Let them find the problems before you name them. Someone will spot “a dozen” or the tilde quantities first. Someone else will catch the misspellings.
Ask: “if I asked you to add up this column, what would you do?” The answer is usually “clean it by hand,” which is exactly the pitfall.
Spot the Pitfall 🎯
Take 60 seconds. What is wrong with that sheet? Call them out.
. . .
Here is what is actually in there:
~11anda dozenin a column that should be a number. 23 of 155 rows, 14.8%.Goup,Conerstone,Summi. Client names that will never match your CRM.01/05/22. Two-digit year. January 5th or May 1st?Repis83. An ID, with no name attached.- No order number anywhere. You cannot join this back to anything.
- And about 2 in 5 of those totals are simply wrong.
This is the interactive warm-up. Keep it to 60 seconds and take four or five call-outs, then move. If the room is quiet, point at one row and ask one person directly.
The “no order number” one is the sleeper. Almost nobody spots it, and it is the most expensive problem on the slide. Save it for last and let it land.
Part 2: Where It Breaks
Six pitfalls. You have met all of them. 🧠
The Six
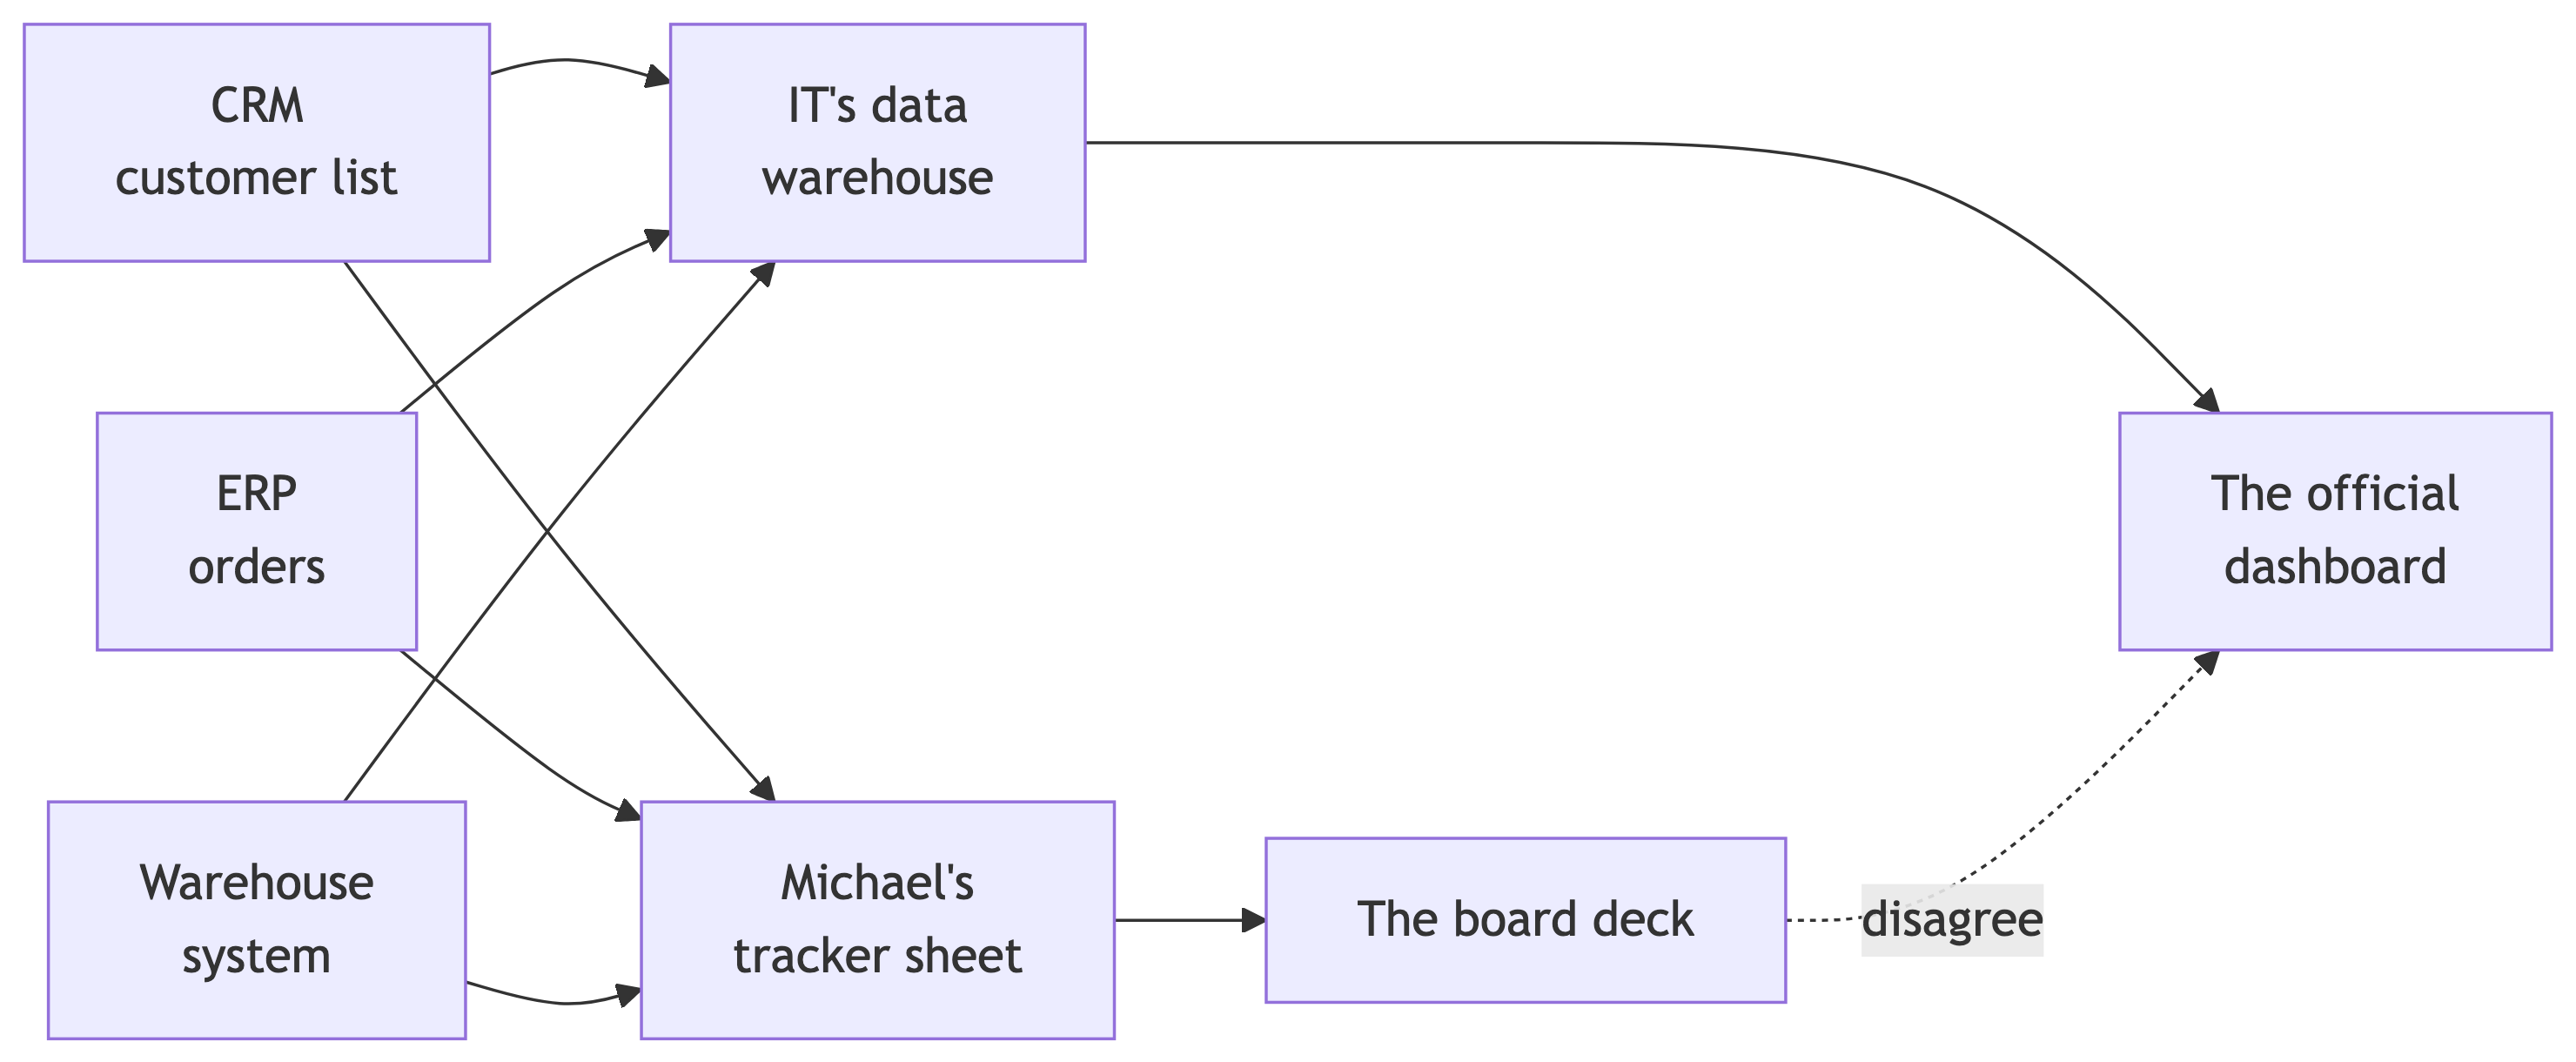
The Stack Underneath
Two paths out of the same three systems. They do not agree, and the disagreement is the deliverable that lands on your desk.
Pitfall 1: No Single Source of Truth
When the same question has two owners, it has two answers.
The tracker says $43,020.24. The system says something else. Neither is labeled “official.”
. . .
SSOT means: for any given number, exactly one system is authoritative, and everyone knows which.
You almost certainly do not have this. That is normal. Knowing where you do not have it is the actual skill.
This is pre-test question 1, the open-answer one. If they can name one violation in their own org by the end of the module, that question is answered.
Do not moralize. Every company has this. The failure is not having it; the failure is not knowing you do not have it.
Pitfall 2: Key Drift
To combine two systems you need a shared key. In practice, the key is missing or mangled.
In the Dunder Mifflin CRM export, of 1,923 rows:
- 97 rows (5.0%) have no
Acct IDat all. - The rest join to the customer list perfectly.
. . .
So 5% of your customers silently vanish from any report built on that join. No error. No warning. The total is just quietly too low.
The word “silently” is the whole slide. A broken join does not throw an error, it returns fewer rows. Your dashboard still renders. It is just wrong.
This is the one that scares experienced people, because they have all shipped it.
Pitfall 3: Format Chaos
The same fact, written five ways, is five facts as far as a computer is concerned.
| What it should be | What it actually is |
|---|---|
| A number | $141.58 (text, with a dollar sign) |
| A date | 10/13/2022 here, 01/05/22 there, ISO somewhere else |
| A quantity | ~11, a dozen |
| A phone number | (682) 486-2143, 2953356785, 209.577.2260 |
| A status | FULFILLED vs Fulfilled |
. . .
Every one of these is a real value in the Dunder Mifflin exports. Sorting that AMT column puts $99 after $1,000.
Pitfall 4: Duplicates
Nobody sets out to double-count. It happens on export.
- CRM export: 61 exactly duplicated rows.
- ERP export: 93 exactly duplicated rows.
. . .
If you sum revenue off the raw ERP export, you have just billed 93 orders twice. Your number is too high, and it is too high in a way that looks completely reasonable.
Pair this with pitfall 2 deliberately. Broken joins make numbers too low, duplicates make them too high, and in a big enough report the two can cancel and make the total look fine.
That is the nightmare scenario worth naming out loud.
Pitfall 5: No Lineage
Data lineage is the map of a number’s entire journey, from the system it was born in to the cell you are looking at.
. . .
Ask of any number on any dashboard:
- Which system did this originate in?
- What was done to it on the way here?
- Who changed that, and when?
. . .
If nobody can answer in under a day, you do not have lineage. You have folklore.
This is pre-test question 4. The distractors are all plausible-sounding (folder hierarchies, archiving, data types), so hammer the actual definition: the journey, origin to report.
“Folklore” gets a laugh and it sticks. Use it.
Pitfall 6: Bus Factor
The tracker lives on one laptop. One person knows the cleanup steps. Those steps live in their head.
. . .
Bus factor of one. If they take a vacation, the report is late. If they leave, the report is gone, and so is any hope of explaining last quarter’s numbers.
Manual steps are not just slow. They are undocumented by construction.
🧠 Quick Quiz: Lineage
A regional revenue number on your dashboard looks 30% too high. What does asking for data lineage actually get you?
A. A backup of the old spreadsheet versions so you can recover the previous number.
B. The map of that number's journey from its origin system to the report.
C. The folder structure on the shared drive where the team's files live.
D. A list of which fields are numbers and which are text.
. . .
B. Lineage is the journey, not the storage. It is what lets you walk backward from the wrong number to the step that broke it, which in this case is probably those 93 duplicated ERP rows. A, C, and D are all real things. None of them tell you where a number came from.
🧠 Quick Quiz: Where to Start
Your team wants a new dashboard. What should you do first?
A. Inventory every data source you currently have access to and map what is in them.
B. Ask IT which tables are already modeled so you can reuse existing work.
C. Write down the decision the dashboard is supposed to change.
D. Pick the visualization tool the company already licenses.
. . .
C. Start with the business question, specifically the decision that hangs on it. Starting from the data you happen to have is how you end up with a beautiful dashboard full of vanity metrics that nobody acts on. A and B are the second question. D is barely a question at all.
This is pre-test question 5. The trap is that A and B are what most competent people actually do, and they feel responsible and thorough.
Good follow-up if there is time: “what decision does your current favorite dashboard change?” Watch the room go quiet.
Part 3: Your Turn
The pitfalls are generic. Yours are specific. 🎯
Turn and Talk
Pairs or Trios: Where Does This Bite You?
Five minutes. Turn to the people next to you.
- Pick one report or number you are responsible for. Name it out loud.
- Which of the six pitfalls does it have? Be specific about the symptom, not the category.
- Who would you have to ask to find out where that number actually comes from? Do you know their name?
. . .
Be ready to give us one sentence on the ugliest one.
This is the whole point of the segment. Protect this time. If you are running long, cut pitfall content, not this.
Timing: 5 minutes of talk, 2 to 3 minutes of share-outs. That is your last 8 minutes.
Facilitation: - Move. Do not stand at the front. Listen for a good story and pre-recruit that person to share, so the share-out is not volunteer roulette. - If a group stalls, ask “what number did somebody argue with you about most recently?” - Question 3 is the sneaky one. Many will not know who owns their own data. That discovery is the setup for the Failures and Governance segment at 11:10, so flag it when it surfaces. - Harvest exactly two or three share-outs. Write the pitfall category on the board next to each. You want the room to see the same six categories catching everything.
What We Just Did
You now have language for a thing you already knew was broken.
| Symptom you have lived | What to call it |
|---|---|
| “Our numbers do not match theirs” | No single source of truth |
| “Half the accounts fell out of the report” | Key drift |
| “It sorted wrong” / “the dates are backwards” | Format chaos |
| “Revenue looks too high” | Duplicates |
| “Where did this number come from?” | No lineage |
| “Only Dave knows how to run it” | Bus factor |
The left column gets you sympathy. The right column gets you a fix.
The Big Ideas
- Two numbers for one question is not a data problem. It is an ownership problem wearing a data costume.
- Broken joins fail silently. They do not error, they just quietly return less. Duplicates fail loudly in the other direction, and the two can cancel out.
- Lineage is the first ask, not the last. “Where did this come from” beats “can you re-run it.”
- Start from the decision. If no decision changes, no dashboard is needed, however pretty it is.
- Name the pitfall, not the feeling. “The CRM has no key on 5% of rows” gets engineering help. “The data is a mess” gets you a shrug.
Up Next
At 9:45 we go from what breaks to what the thing that breaks is actually made of: the modern data pipeline, and the vocabulary that comes with it.
Then at 10:15 you build one yourself, in Excel, using this exact Dunder Mifflin data.
Explicit handoff to Jed for the Big Picture Pipelines segment. Keep it to fifteen seconds.
References
- Dunder Mifflin Paper Company dataset. https://github.com/LucasCordova/dunder-mifflin-dataset
- Data figures cited here come from
data/excel_starter/, the Scranton 2022 slice of that dataset, and were verified against the files directly. - Kimball, R. and Ross, M. The Data Warehouse Toolkit, 3rd ed. Wiley, 2013. Chapter 1, on conformed dimensions and why a single source of truth is a design decision rather than an accident.
- Microsoft. “Data lineage in Microsoft Purview.” https://learn.microsoft.com/en-us/purview/concept-data-lineage