Lecture 1-3: Mini-pipelines using Power Query
AI for Decision Makers: Data Architecture
Abstract
Third segment of the Data Architecture module (10:15 to 11:00, 45 minutes, hands-on included). Power Query is ETL that ships inside Excel. We clean three deliberately messy Dunder Mifflin exports, combine them, reconcile a hand-kept tracker against the system of record, and use the Applied Steps pane as readable data lineage. Closes with the three signals that mean it is time to hand your mini-pipeline to IT.
Learning Objectives
Today’s Objectives
What You’ll Leave With
By the end of this segment, you will be able to:
- Map Power Query’s three panes onto the ETL vocabulary you heard at 9:45.
- Build a small repeatable pipeline that loads, cleans, and combines two messy CSV exports.
- Distinguish a Merge from an Append, and say which one you need out loud.
- Read the Applied Steps pane as data lineage, and refresh the whole chain with one click.
- Decide when a mini-pipeline should stop being yours and become IT’s.
. . .
Module Connection: This serves Module Objective 2, demonstrating the use of existing tooling to build and automate small data pipelines. It is also the answer to Jed’s question from 9:45: this is how you go beyond the spreadsheet, without leaving it.
Forty-five minutes, hands-on included. Rough shape:
- 0 to 18: Parts 1 through 3, instruction
- 18 to 38: Part 4, hands-on, you are wandering
- 38 to 45: Parts 5 and 6, lineage and the IT handoff
If you are behind at minute 18, cut Part 3 to the one flowchart slide and start the hands-on anyway. The hands-on is the objective. The slides are not.
Get the Data First
Download and unzip this now, before we talk. It is 392 KB.
dunder-mifflin-power-query.zip ↓
| File | Rows | What it is |
|---|---|---|
crm_customer_export.csv |
1,923 | Customer list out of the CRM. Messy. |
erp_orders_export.csv |
4,665 | Orders out of the ERP. Messy. |
regional_manager_tracker.csv |
155 | Michael’s hand-kept sheet. Very messy. |
customers.csv |
2,172 | The clean customer list. Join target. |
sales_order_lines.csv |
15,337 | The system of record for revenue. |
All Scranton, 2022. Everything opens in Excel instantly.
Do this first so the download finishes while you talk. If wifi is bad, have it on a USB stick. You will lose the segment if fifteen people are downloading at minute 18.
Part 1: Power Query Is Just ETL
You already own an ETL tool. It has been sitting in the Data ribbon this whole time. 🐢
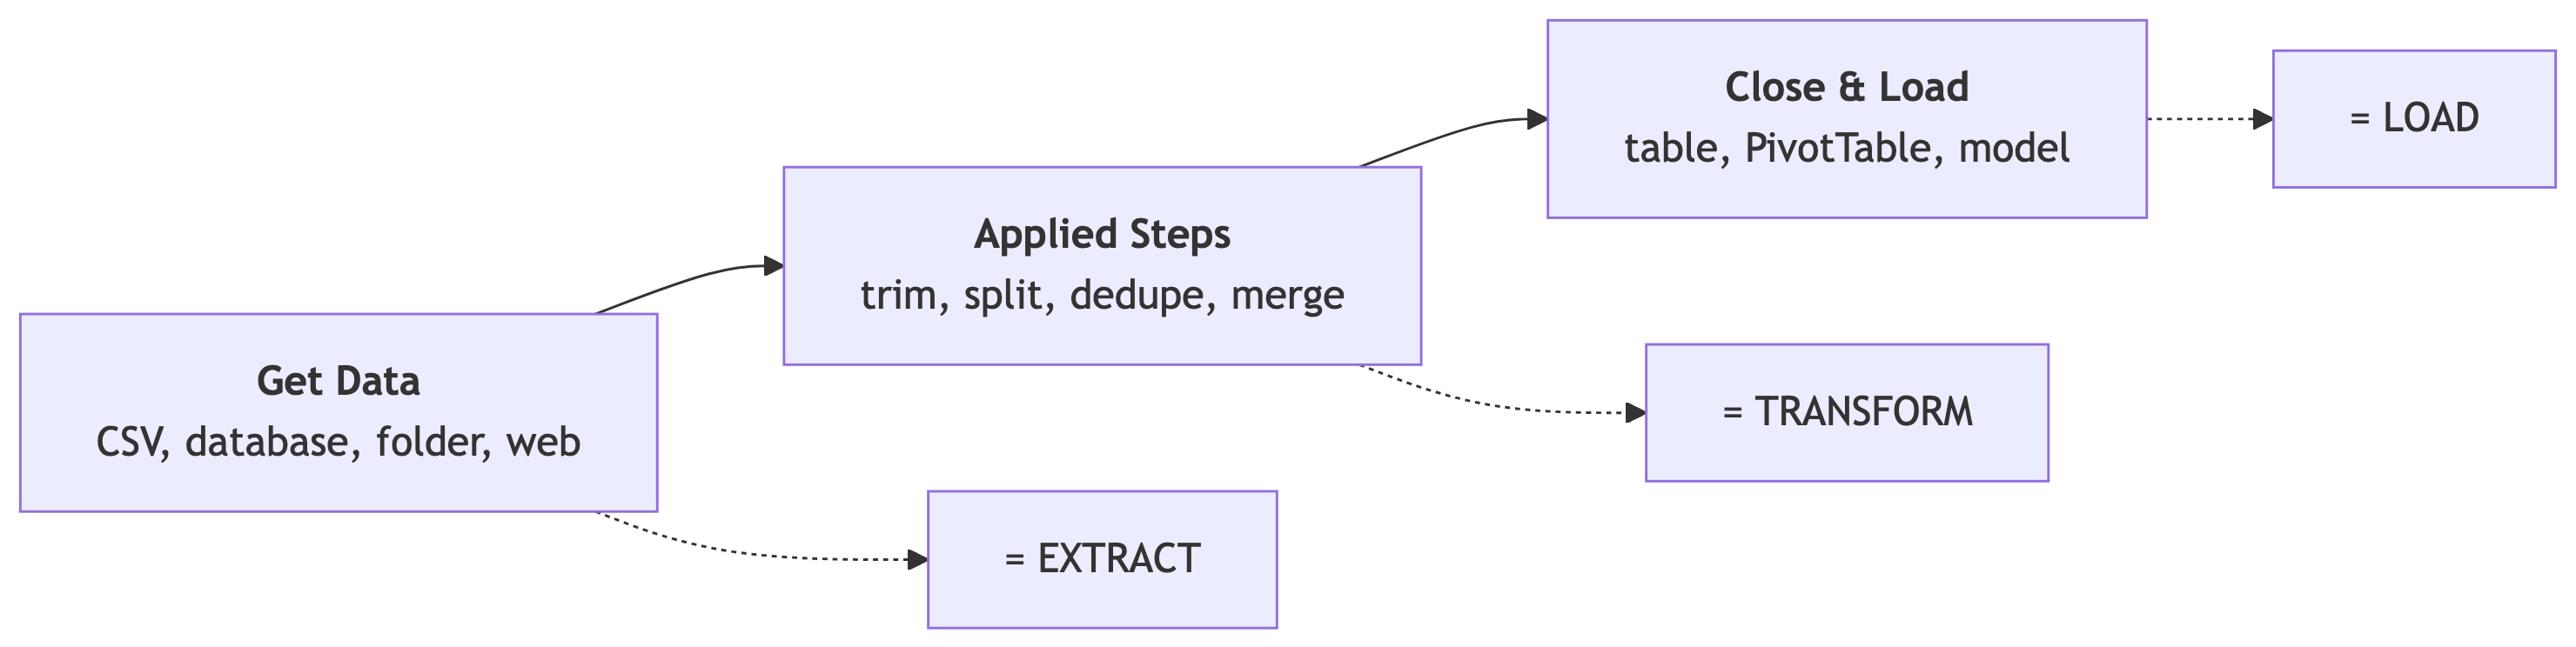
Extract, Transform, Load
The Vocabulary You Just Learned, In A Tool You Already Have
At 9:45 you heard ETL: Extract, Transform, Load. It sounded like something IT does in a server room.
. . .
Power Query is those three letters with a mouse attached. Same concepts, same vocabulary, no server room.
This is pre-test question 2, straight up. If they leave knowing E, T, and L stand for Extract, Transform, and Load, that question is answered.
The real move here is confidence. They think ETL is exotic. It is the thing they have been doing by hand, badly, for years. Say that out loud.
Why Not Just Do It By Hand?
You already clean data. You do it with copy, paste, find-and-replace, and a column of =TRIM().
. . .
That works exactly once.
By hand
Next month’s file arrives. You do all of it again. From memory. Slightly differently.
No record of what you did.
Power Query
Next month’s file arrives. You click Refresh.
Every step is written down, in order.
. . .
The difference is not speed. It is that one of them is a pipeline and the other is a habit.
Where It Lives
Windows Excel: Data ribbon → Get Data → From File → From Text/CSV.
Mac Excel: Data → Get Data (Power Query). It exists but is thinner. Fuzzy merge and some transforms are missing.
. . .
WarningIf you are on a Mac
Pair up with someone on Windows for the hands-on. You will still get the concepts, and the concepts are what you are being tested on. The clicking is not the point.
Ask for a show of hands on Mac versus Windows before the hands-on starts, not during. Pair them physically. A Mac user alone will spend twenty minutes fighting the UI and learn nothing.
🧠 Quick Quiz: ETL
In data engineering, what do the letters E, T, and L stand for?
A. Execute, Transfer, and Log
B. Extract, Transform, and Load
C. Export, Transition, and Link
D. Encryption, Troubleshooting, and Licensing
. . .
B. Extract, Transform, Load. And you have now watched all three happen in Excel’s Data ribbon. When IT says “the ETL job failed,” they mean one of those three steps broke, and you now have a vocabulary for asking which.
Part 2: Three Files, Three Different Cleans
Each mess is a different lesson. That is not an accident. 🧠
File 1: The CRM Export
crm_customer_export.csv, 1,923 rows. Here is what is wrong with it.
| Problem | Evidence | The fix |
|---|---|---|
| Inconsistent case | riverside manufacturing llc |
Transform → Format → Capitalize Each Word |
| Stray whitespace | Keystone Retail Associates |
Transform → Format → Trim |
| Duplicate rows | 61 exact duplicates | Home → Remove Rows → Remove Duplicates |
| Missing key | 97 rows (5.0%) have no Acct ID |
Filter them out, or flag them. Decide on purpose. |
| Phone chaos | (682) 486-2143, 2953356785, 209.577.2260 |
Split, or strip non-digits |
| Missing fields | 200 blank Segment, 109 blank City |
Replace with Unknown, do not leave null |
The 97 Rows Are The Lesson
The duplicates and the casing are annoying. The 97 missing keys are dangerous.
. . .
Join CRM to customers.csv on Acct ID and you get a clean result. Excel reports no error. Your PivotTable renders beautifully.
. . .
And 97 customers are not in it. Your revenue is quietly 5% light and nothing anywhere says so.
. . .
This is why “did it error?” is the wrong question. The right question is “how many rows went in, and how many came out?”
Callback to pitfall 2 from 9:30. If they only remember one thing from the whole module, it should be row counts in versus row counts out.
Good aside: this is exactly how a real revenue miss happens. Nobody lies. A join just drops rows and everyone downstream trusts the total.
File 2: The ERP Export
erp_orders_export.csv, 4,665 rows. Different mess, different fixes.
| Problem | Evidence | The fix |
|---|---|---|
| Money as text | $141.58 |
Replace Values to strip $ and ,, then set type Decimal |
| US date strings | 10/13/2022 |
Set type Date using Locale → English (United States) |
| Shouting status | FULFILLED, RETURNED, CANCELLED |
Format → Capitalize Each Word |
| Blank ship dates | 175 blanks | These are the cancelled ones. Keep the blank, it means something. |
| Duplicate rows | 93 exact duplicates | Remove Duplicates |
. . .
Sum that AMT column as-is and you get zero. It is text. Excel is not being difficult, it is being correct.
Using Locale Is The Whole Ballgame
10/13/2022 is unambiguous. 01/05/22 is not.
. . .
Is that January 5th or May 1st? The file will not tell you. Power Query will guess based on your machine’s regional settings, and it will guess silently, and it may guess differently on your colleague’s laptop in a different region.
. . .
Transform → Data Type → Using Locale... → pick the locale on purpose.
This is a genuinely nasty real-world bug and it is worth the ninety seconds. A pipeline that works on your laptop and breaks on a colleague’s, with no error, just a different number, is the kind of thing that erodes trust in the whole data team.
The tracker’s two-digit dates make this concrete: 01/05/22 in that file really is ambiguous.
File 3: The Tracker
regional_manager_tracker.csv, 155 rows. This one does not have a clean fix, and that is the point.
| Problem | Evidence |
|---|---|
| Free text in a number column | ~11, a dozen. 23 of 155 rows, 14.8% |
| Typo’d names | Redwood Financial Goup, Conerstone Retail, Summi Hospitality |
| Two-digit ambiguous dates | 01/05/22 |
| No order number at all | There is no key. None. |
| Totals that are wrong | About 2 in 5 disagree with the system of record |
. . .
You cannot join this to anything by key, because there is no key. Welcome to every hand-kept spreadsheet in your company.
So What Do You Do With It?
Power Query has an answer, and it is a little bit magic: fuzzy matching.
Home → Merge Queries → check Use fuzzy matching to perform the merge → set a similarity threshold.
. . .
Summi Hospitality Co will match Summit Hospitality Co at about 0.9 similarity.
. . .
ImportantFuzzy matching is a triage tool, not a fix
It will also confidently match the wrong thing. Use it to find the rows a human needs to look at, never to silently repair data you then report on. If you fuzzy match your way to a revenue number, you have invented a revenue number.
Managers love fuzzy matching the moment they see it, which is exactly why the callout matters. Say the last sentence slowly. “You have invented a revenue number.”
Mac Excel does not have fuzzy merge. Another reason to pair.
🧠 Quick Quiz: Which Clean?
Your AMT column contains $1,234.56 and every attempt to sum it returns 0. What happened?
A. The column has duplicate rows that cancel each other out.
B. The values are text, not numbers, because of the dollar sign and comma.
C. Excel's calculation mode is set to manual.
D. The column contains blank rows that break the SUM range.
. . .
B. A leading $ makes the whole value text. SUM politely ignores text and returns zero. Strip the $ and , with Replace Values, then set the type to Decimal Number. This is the single most common “the spreadsheet is broken” support ticket in existence.
Part 3: Combine
Two ways to put data together. Managers who can name the difference get better help from IT. 🧠
Merge or Append?
The Only Two Options
Merge = wider
Match rows across tables on a shared key. Adds columns.
“Attach each order to its customer’s segment.”
SQL calls this a JOIN.
Append = taller
Stack rows from tables with the same shape. Adds rows.
“Combine Q1, Q2, Q3, and Q4 into one year.”
SQL calls this a UNION.
. . .
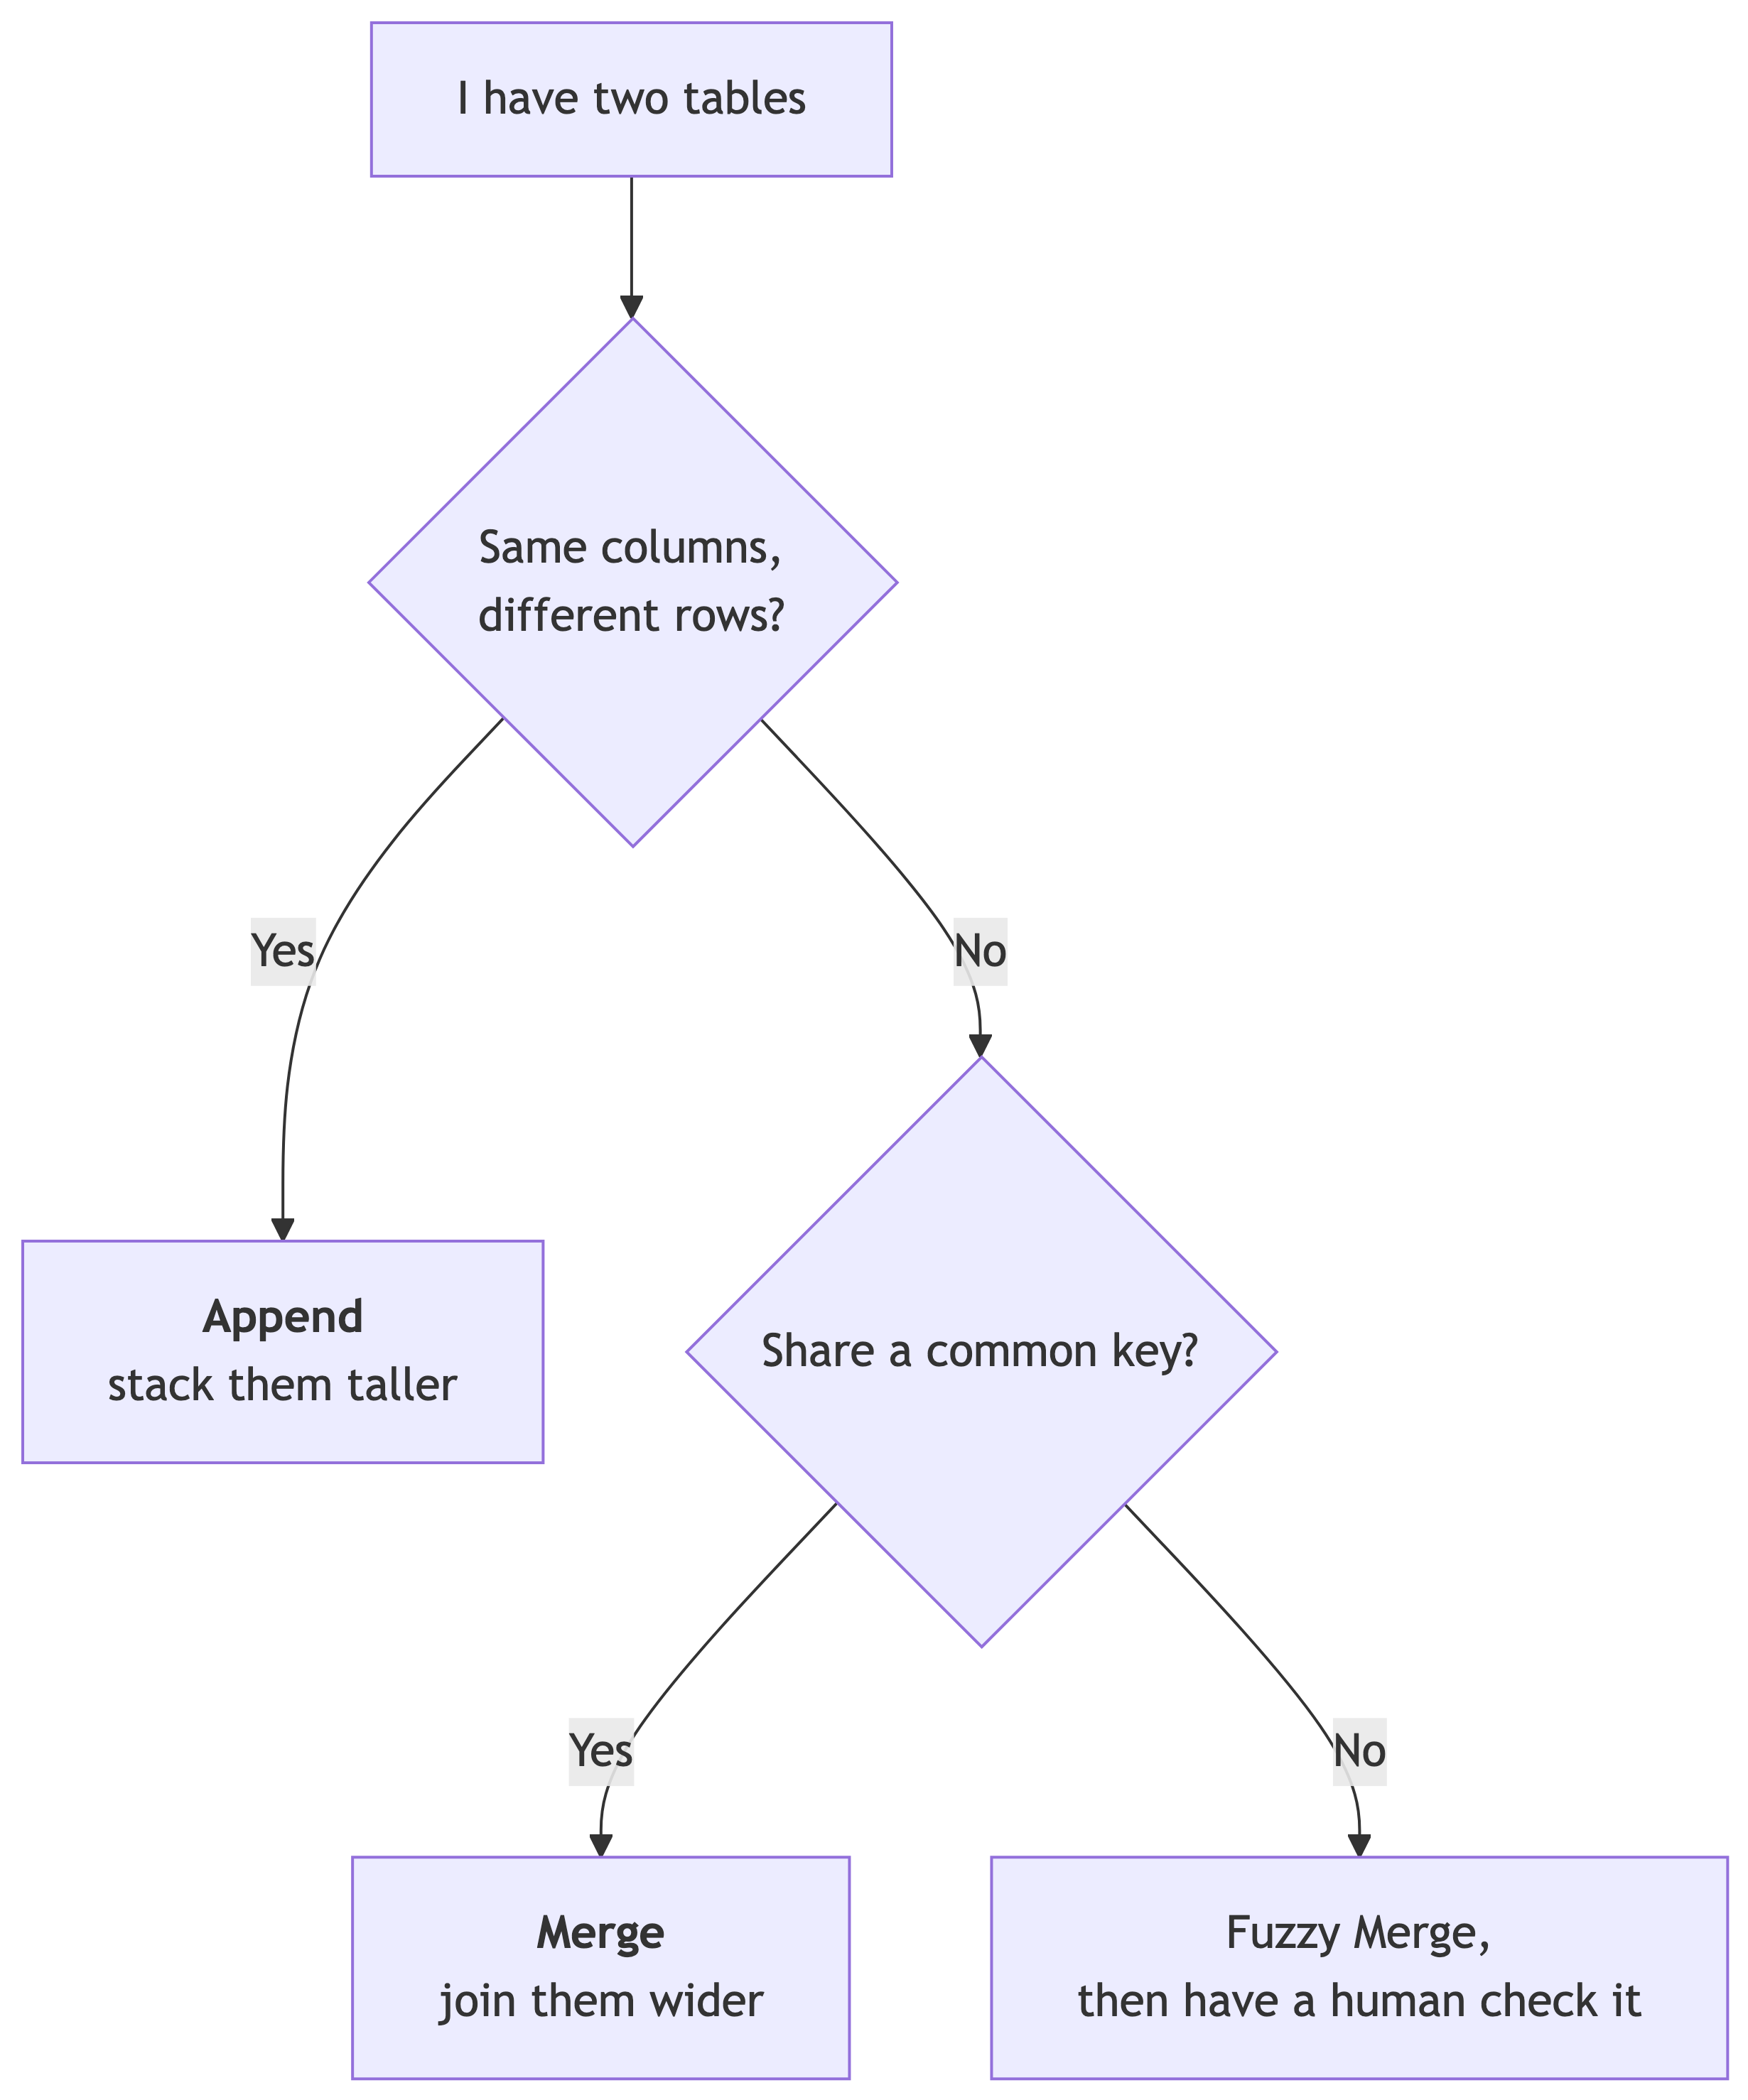
This slide is worth more than it looks. “I need to append twelve monthly files” is a request IT can act on in an hour. “Can you combine my spreadsheets” is a two-week email thread.
Naming the operation is the deliverable.
Merge Has A Trap
When you Merge, Power Query asks for a Join Kind. The default is Left Outer.
. . .
That default is usually right, and it is also how you lose those 97 keyless rows without noticing.
. . .
After every Merge, do exactly one thing: look at the row count in the status bar. Did it change? Did it change the way you expected?
. . .
If your 1,923 rows became 1,826, you just silently dropped 97 customers. If they became 2,400, you just duplicated something.
🧠 Quick Quiz: Merge or Append
You have twelve monthly sales exports, all with identical columns, and you need one table for the year. Which operation?
A. Merge, joining each month to the next on the date column.
B. Append, stacking all twelve into one table.
C. Merge with fuzzy matching, since the file names differ.
D. Neither. You need IT to build a database first.
. . .
B. Same shape, different rows, so you stack them. Append. Better still, point Power Query at the folder with Get Data → From Folder and it appends every file in there automatically, including next month’s when you drop it in.
Part 4: Hands-On
Twenty minutes. Build the thing. 🎯
Build a Mini-pipeline
Try It: Load and Clean the CRM 🎯
Get crm_customer_export.csv into Excel and make it trustworthy.
Target: a clean customer table with no duplicates, consistent names, and a decision made about the missing keys.
. . .
Steps:
Data→Get Data→From File→From Text/CSV→ pick the file →Transform Data(notLoad).- Select
Account Name→Transform→Format→Trim, thenFormat→Capitalize Each Word. Home→Remove Rows→Remove Duplicates. Watch the row count: 1,923 drops to 1,862.- Set
Acct IDtype toWhole Number. The blanks becomenull. - Right-click
Acct ID→Remove Emptyor add a filter. Either way, you decided. Note how many you dropped. Home→Close & Load To...→Only Create Connection.
You just built an ETL pipeline. That is Extract, Transform, and Load, in six clicks.
Wander. Most common sticking points, in order:
- They hit
Loadinstead ofTransform Dataand land in a worksheet with no editor open. Fix:Data→Queries & Connections, double-click the query. - They cannot find
Remove Duplicatesbecause they have a column selected instead of using theHomeribbon’sRemove Rowsdropdown. - Mac users cannot find
Get Data (Power Query). Pair them.
If someone finishes in four minutes, send them to the fuzzy merge slide early.
Try It: Merge to the Customer List 🎯
Attach each CRM row to its canonical record in customers.csv, and find out what falls out.
Hint: you need both tables loaded as queries before you can merge them.
. . .
Steps:
- Load
customers.csvthe same way.Close & Load To...→Only Create Connection. Data→Get Data→Combine Queries→Merge.- Top table: your CRM query. Bottom:
customers. ClickAcct IDandcustomer_idto pair them. - Join Kind: Left Outer.
OK. - Expand the new column (the ⇄ icon) and pick
segmentandregion. - Filter the expanded
segmentcolumn fornull.
. . .
Those nulls are your keyless rows. They are in your report, contributing nothing, and if you had summed revenue by segment you would never have seen them.
Try It: Reconcile the Tracker 🎯
The hard one. Michael’s sheet says Scranton did $43,020.24. Does the system of record agree?
Hint: there is no key. You will need fuzzy matching, and you will not fully succeed. That is the finding.
. . .
Steps:
- Load
regional_manager_tracker.csv. Look atQty. Set it toWhole Numberand watch 23 rows turn into errors. - Those errors are
~11anda dozen.Keep Errorsto see them. This is your data quality report. - Merge the tracker to
customersonClient↔︎customer_name, with fuzzy matching on. - Drop the threshold to 0.8. Watch
Summi Hospitality CofindSummit Hospitality Co. - Now try to check the totals against
sales_order_lines. You cannot, cleanly. There is no order number to join on.
. . .
That is the answer. The sheet cannot be reconciled, because it was never built to be. About 2 in 5 of its totals are wrong and there is no way to prove which ones from the file alone.
This is the payoff for the whole module and the callback to 9:30. Do not rescue them. Let them hit the wall on step 5.
The lesson is not “Power Query is limited.” It is that no tool can reconcile a sheet that has no key. The fix is upstream: the tracker should have recorded the order number. That is a conversation with a process owner, not a data problem.
If a group asks “so what do we do?”, the answer is: you stop using the tracker as a source of truth, and you go get the number from the system that has keys.
Debrief
Hands up. Who got a different row count than the person next to them?
. . .
That is the entire reason Applied Steps exists.
Two minutes, max. Take one or two answers. The row-count divergence is the bridge into Part 5, so if nobody diverged, just ask “how would you prove to me what you did?”
Part 5: Refresh and Lineage
The part where it stops being a chore and starts being infrastructure. 🐢
Applied Steps
Your Steps Were Being Written Down
Look at the right-hand pane. Applied Steps. Every click you made is there, in order, named.
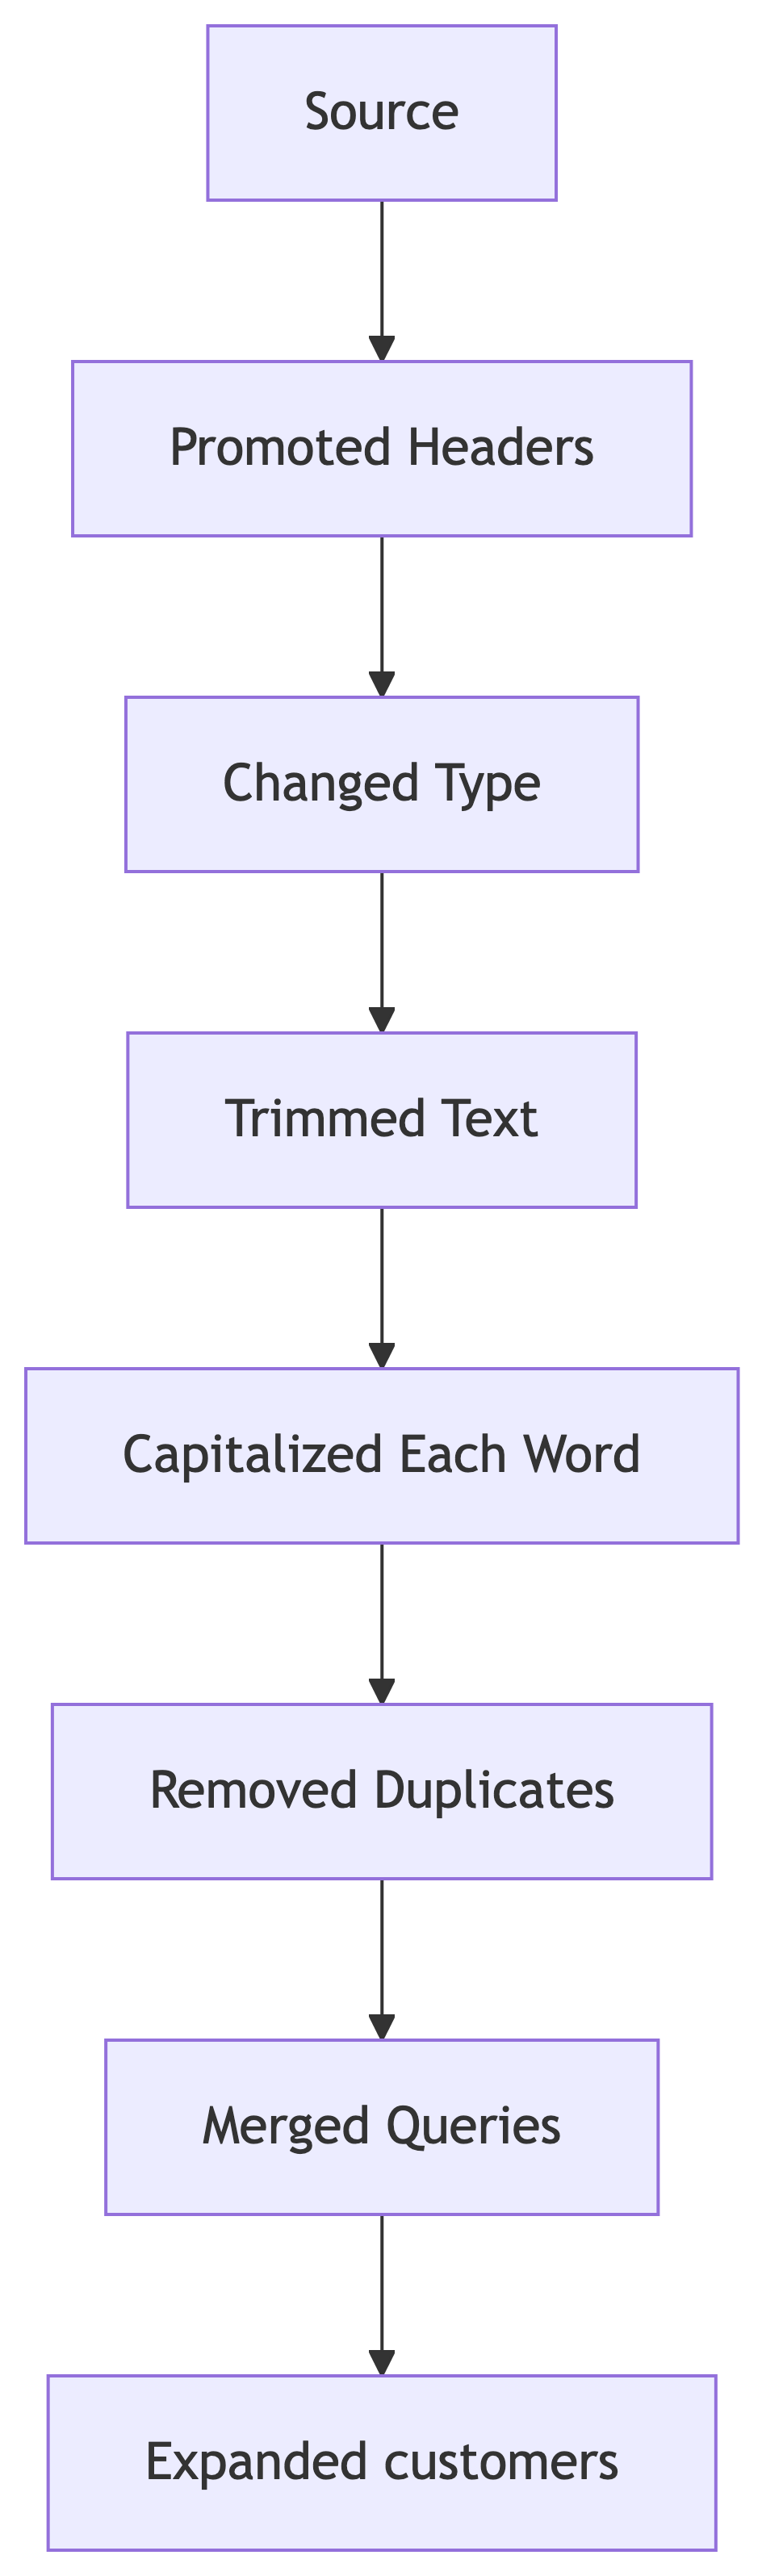
. . .
Click any step. The preview jumps back to how the data looked at that moment. You can insert a step in the middle. You can delete one. You can rename them so a human can read them.
This Is Lineage
At 9:30 we said lineage is the map of a number’s journey from origin to report, and that if nobody can trace it, you have folklore.
. . .
Applied Steps is that map. For this one pipeline, you can answer all three questions:
- Where did it come from? The
Sourcestep names the file. - What was done to it? Six steps, in order, each named.
- Who changed it and when? The workbook, and its version history.
. . .
You did not build a cleaned spreadsheet. You built a documented, re-runnable, auditable cleaned spreadsheet. Those are different objects.
The Refresh
Next month, Scranton sends a new export. Same columns, new rows.
. . .
You drop it in the same path and click Refresh.
. . .
Trim, capitalize, dedupe, merge, expand. All of it. In about a second. Exactly the way you did it last month, because it is the same steps, not your memory of them.
. . .
That is the “automate” half of the objective. And it is why your February number is comparable to your January number, which is a thing your current process almost certainly cannot promise.
Land this hard. The reproducibility argument is what converts a manager. Not the time saved. The fact that this month and last month were computed the same way.
If you have a live workbook, actually click Refresh here. It is a good moment.
Part 6: When Do You Hand This to IT?
Know when you have outgrown your own pipeline. 🧠
The Handoff
Three Signals
You built a pipeline. Congratulations. Now, when should it stop being yours?
. . .
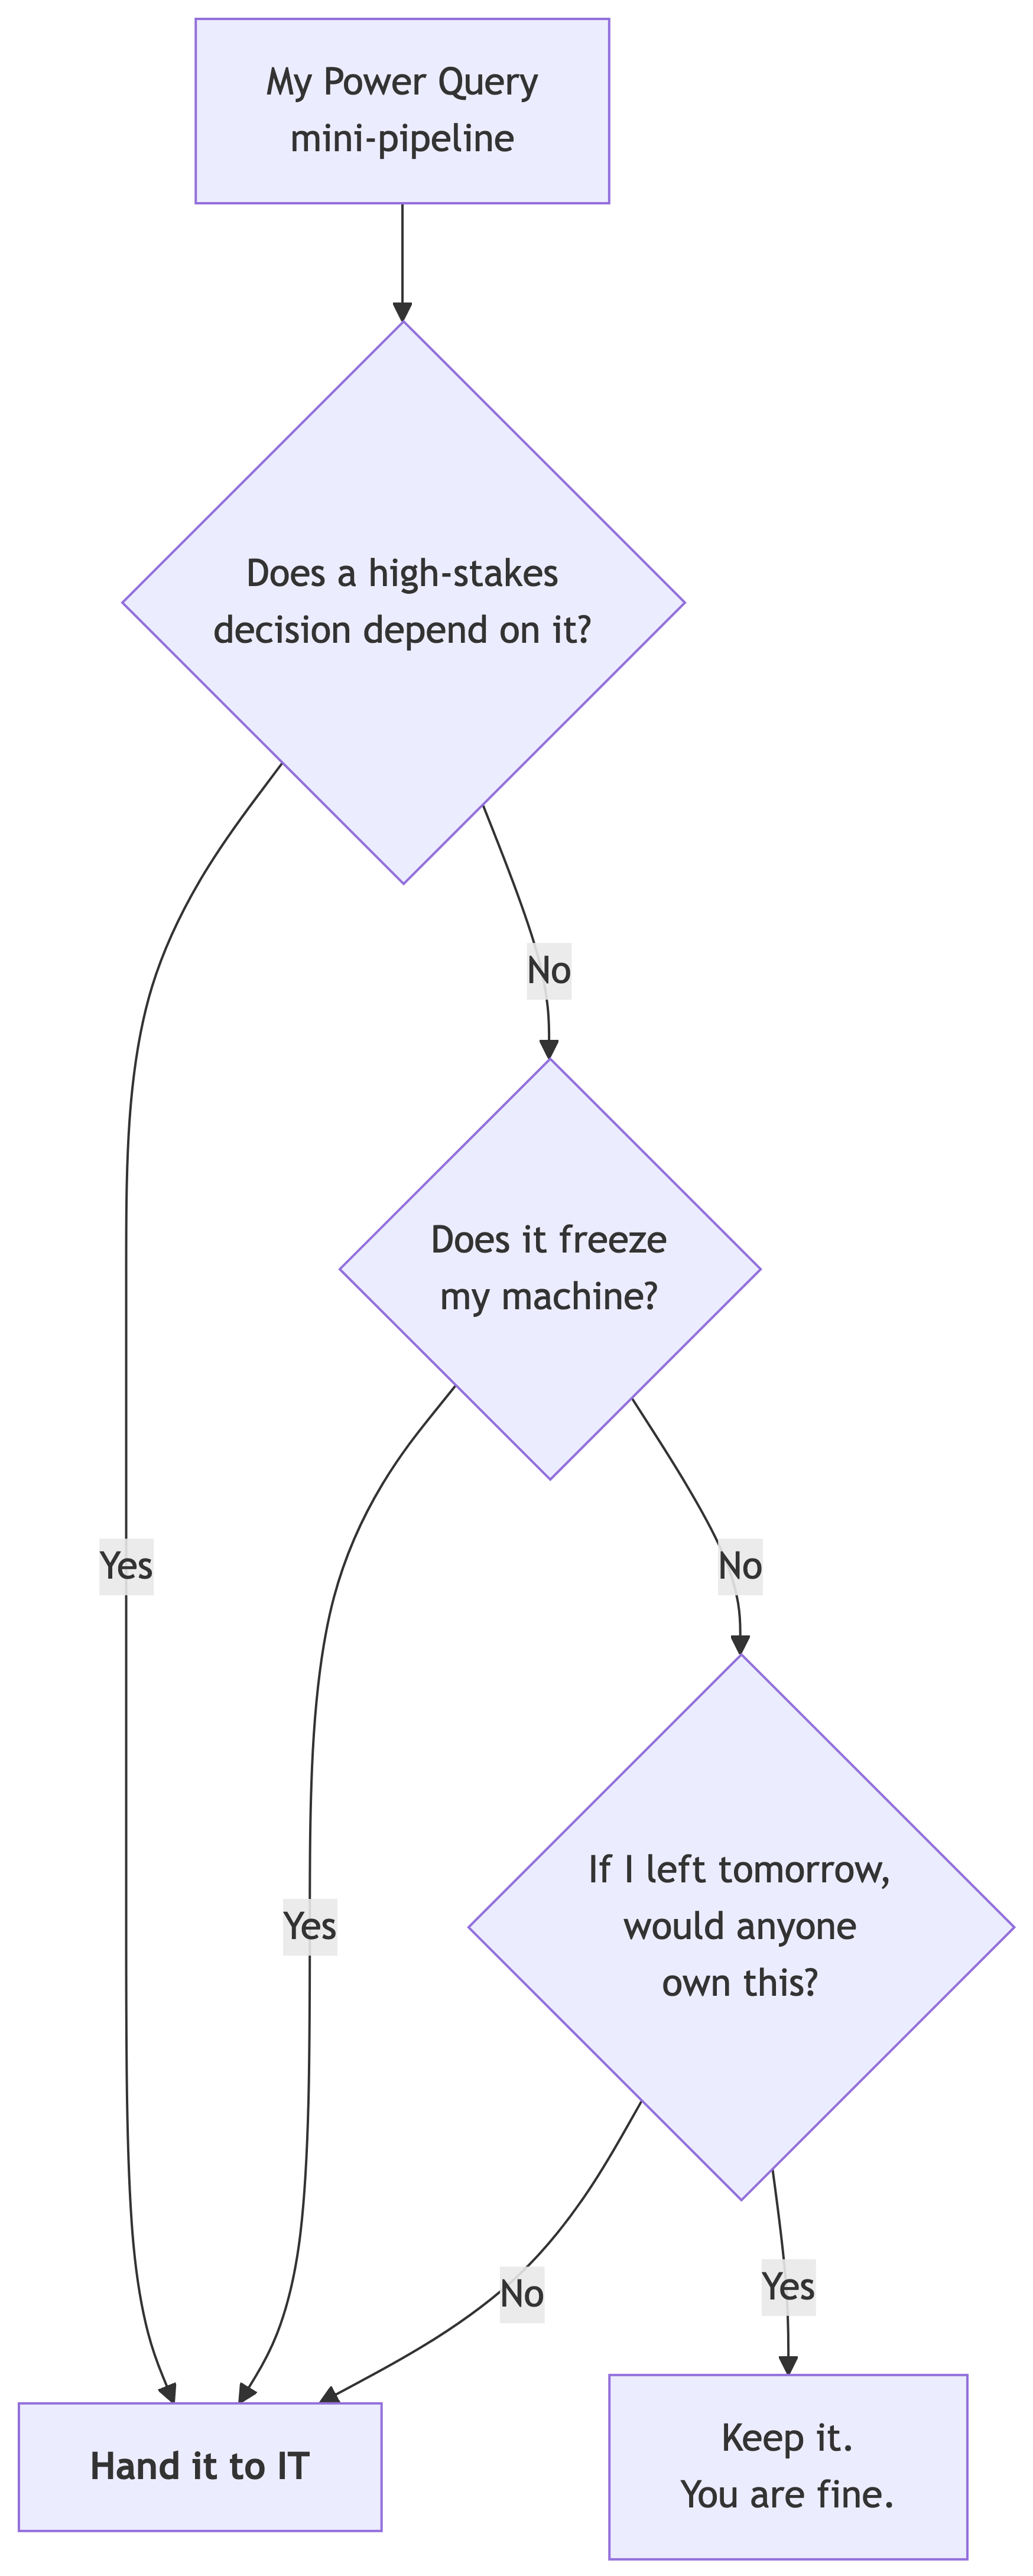
. . .
Stakes. Volume. Ownership. If any one of those trips, it is time.
This is pre-test question 3, and the distractors are all seductive: a row threshold, an IT mandate, full automation. None of those are the trigger.
Emphasize that “keep it, you are fine” is a real and common answer. The lesson is not that everything belongs to IT. Most mini-pipelines should stay exactly where they are.
Not The Signals
Things that do not mean you should hand it off:
- ❌ “The file got past 50,000 rows.” Row counts are not a governance policy.
- ❌ “IT told us to stop using Excel.” That is a turf memo, not an engineering decision.
- ❌ “I want it fully automated so nobody ever checks the data again.” Nobody should ever want this.
. . .
The real trigger is always about consequence, not size.
Volume: Let’s Be Honest
The full Dunder Mifflin sales_order_lines is 215,485 rows. Excel’s limit is 1,048,576.
. . .
So it fits. It fits fine.
. . .
Now put a VLOOKUP in a column next to it and try to scroll. Now refresh it. Now email it to somebody.
. . .
“It fits” and “it works” are different claims. The limit is not the row count, it is the moment your laptop fan becomes part of the meeting.
Be accurate here. It is tempting to say “too big for Excel,” and it is false. 215k rows fits. The problem is performance and fragility, not capacity.
Say the honest version. This audience has been lied to about Excel’s limits before and they know it.
🧠 Quick Quiz: The Handoff
At what point does a mini-pipeline in Power Query become something you hand to the data or IT team?
A. As soon as the file exceeds 50,000 rows or needs more than 10 columns altered.
B. Only when IT explicitly mandates that local Excel usage stop.
C. When the report drives high-stakes decisions, handles volumes that freeze local machines, or has no backup owner if its creator leaves.
D. When you want it fully automated so no human ever has to check data quality again.
. . .
C. Stakes, volume, ownership. A is arbitrary. B is politics. D is the fantasy that gets companies into trouble, because someone always has to check the data. The honest test is: if this breaks while I am on vacation, what happens?
What To Actually Say To IT
You are not asking them to “fix your spreadsheet.” You are handing over a specification.
. . .
You can now say:
“I have a mini-pipeline that extracts the CRM and ERP exports, transforms them by trimming names, deduping 61 rows, and coercing the
AMTtext into decimals, then merges them to the customer dimension onAcct IDwith a left outer join. About 5% of rows have no key and currently drop out. It drives the regional revenue number the VP sees monthly, and I am the only person who knows how to run it.”
. . .
That is a requirements document. You just wrote it by clicking around in Excel for twenty minutes.
This is the module objective in one slide. Read the quote out loud, in full, slowly. It sounds absurdly fluent and that is the point: every word in it is something they did or saw today.
This is what “communicate about pipeline components and feasibility with IT teams” actually looks like in practice. Then hand off to the 11:10 Failures and Governance segment, where those three questions to ask a data team come from exactly this posture.
Technique Summary
| Technique | What It Does |
|---|---|
Get Data → From Text/CSV |
Extract. Start of every pipeline. |
Transform Data |
Opens the editor. Not Load. |
Trim / Capitalize Each Word |
Kills whitespace and casing drift |
Remove Duplicates |
Kills double-counting |
Replace Values + Decimal Number |
Turns $141.58 into money |
Data Type → Using Locale |
Makes ambiguous dates unambiguous, on purpose |
Merge Queries |
Join on a key. Wider. |
Append Queries |
Stack same-shaped rows. Taller. |
| Fuzzy matching | Triage for typo’d keys. Never for silent repair. |
Get Data → From Folder |
Appends every file in a folder, forever |
| Applied Steps | Your lineage, written down |
Refresh |
Runs the whole chain again, identically |
The Big Ideas
- You already own an ETL tool. Extract, Transform, Load has been in the Data ribbon the entire time, and now you can name what it is doing.
- Check the row count after every join. A broken join does not error. It just returns less, and your report renders anyway.
- Merge is wider, Append is taller. Say the right word to IT and get help in an hour instead of a fortnight.
- Applied Steps is lineage. The pipeline documents itself, which is the only kind of documentation that ever survives contact with a deadline.
- A sheet with no key cannot be reconciled. Not by you, not by Power Query, not by IT. That is a process fix, upstream, not a data fix.
- Hand it off for stakes, volume, or ownership. Never for row count, never because of a memo.
Up Next
11:10, Failures and Governance. You now have a pipeline that works. Next we talk about what happens when it does not, and the three questions to ask the team that owns the data you depend on.
You will find you already know why those questions matter. You spent this segment being the person who would have to answer them.
References
- Dunder Mifflin Paper Company dataset. https://github.com/LucasCordova/dunder-mifflin-dataset. Files used here are the Scranton 2022 slice in
data/excel_starter/; all row counts on these slides were verified against those files directly. - Microsoft. “Power Query documentation.” https://learn.microsoft.com/en-us/power-query/
- Microsoft. “Merge queries overview.” https://learn.microsoft.com/en-us/power-query/merge-queries-overview
- Microsoft. “Fuzzy merge.” https://learn.microsoft.com/en-us/power-query/fuzzy-matching
- Microsoft. “Import data from a folder with multiple files.” https://learn.microsoft.com/en-us/power-query/connectors/folder