
Week 6: Roadmap, Planning Rituals, and the Data Story
DATA 510: Data Science Capstone
June 15, 2026
Learning Objectives
Today’s Objectives
What You Will Leave With
- Place your project on the roadmap and explain how each milestone becomes a section of the final write-up.
- State what the Data Summary (M2) must demonstrate, and how iterations are now sized to each milestone.
- Plan tonight’s iteration: Ready cards on the board, each with a Create / Observe / Analyze triple, a milestone tag, and a size.
- Frame your project as a data story, told as a user story, and place it in a write-up skeleton.
Course Connection
Everything you produce is reviewed by me and your peer Stakeholder POs, and every milestone is a section you bank toward the final write-up.
This hour sets up your Data Summary (M2) push and the studio rhythm you will run at the milestone boundary. It carries Course Objective 1 (development practices for publication) and Course Objective 4 (communicating findings clearly).
Part 1: The Roadmap
The proposal was the promise. Here is how we keep it.

The Roadmap
You Are Here 📍
The proposal is in❗ Peer feedback is in❗ The Data Summary is next, at the end of week 7. Two class meetings stand between you and that gate.
The proposal tells us what you intend to do. Everything from here is you doing it, one milestone at a time.
Every Milestone Is a Section of the Write-Up
Nothing you submit this term is throwaway. Each milestone is a section you bank toward the final write-up. The proposal is already your first section: the project description, the motivation, the question, the stakeholders.
Visually Speaking
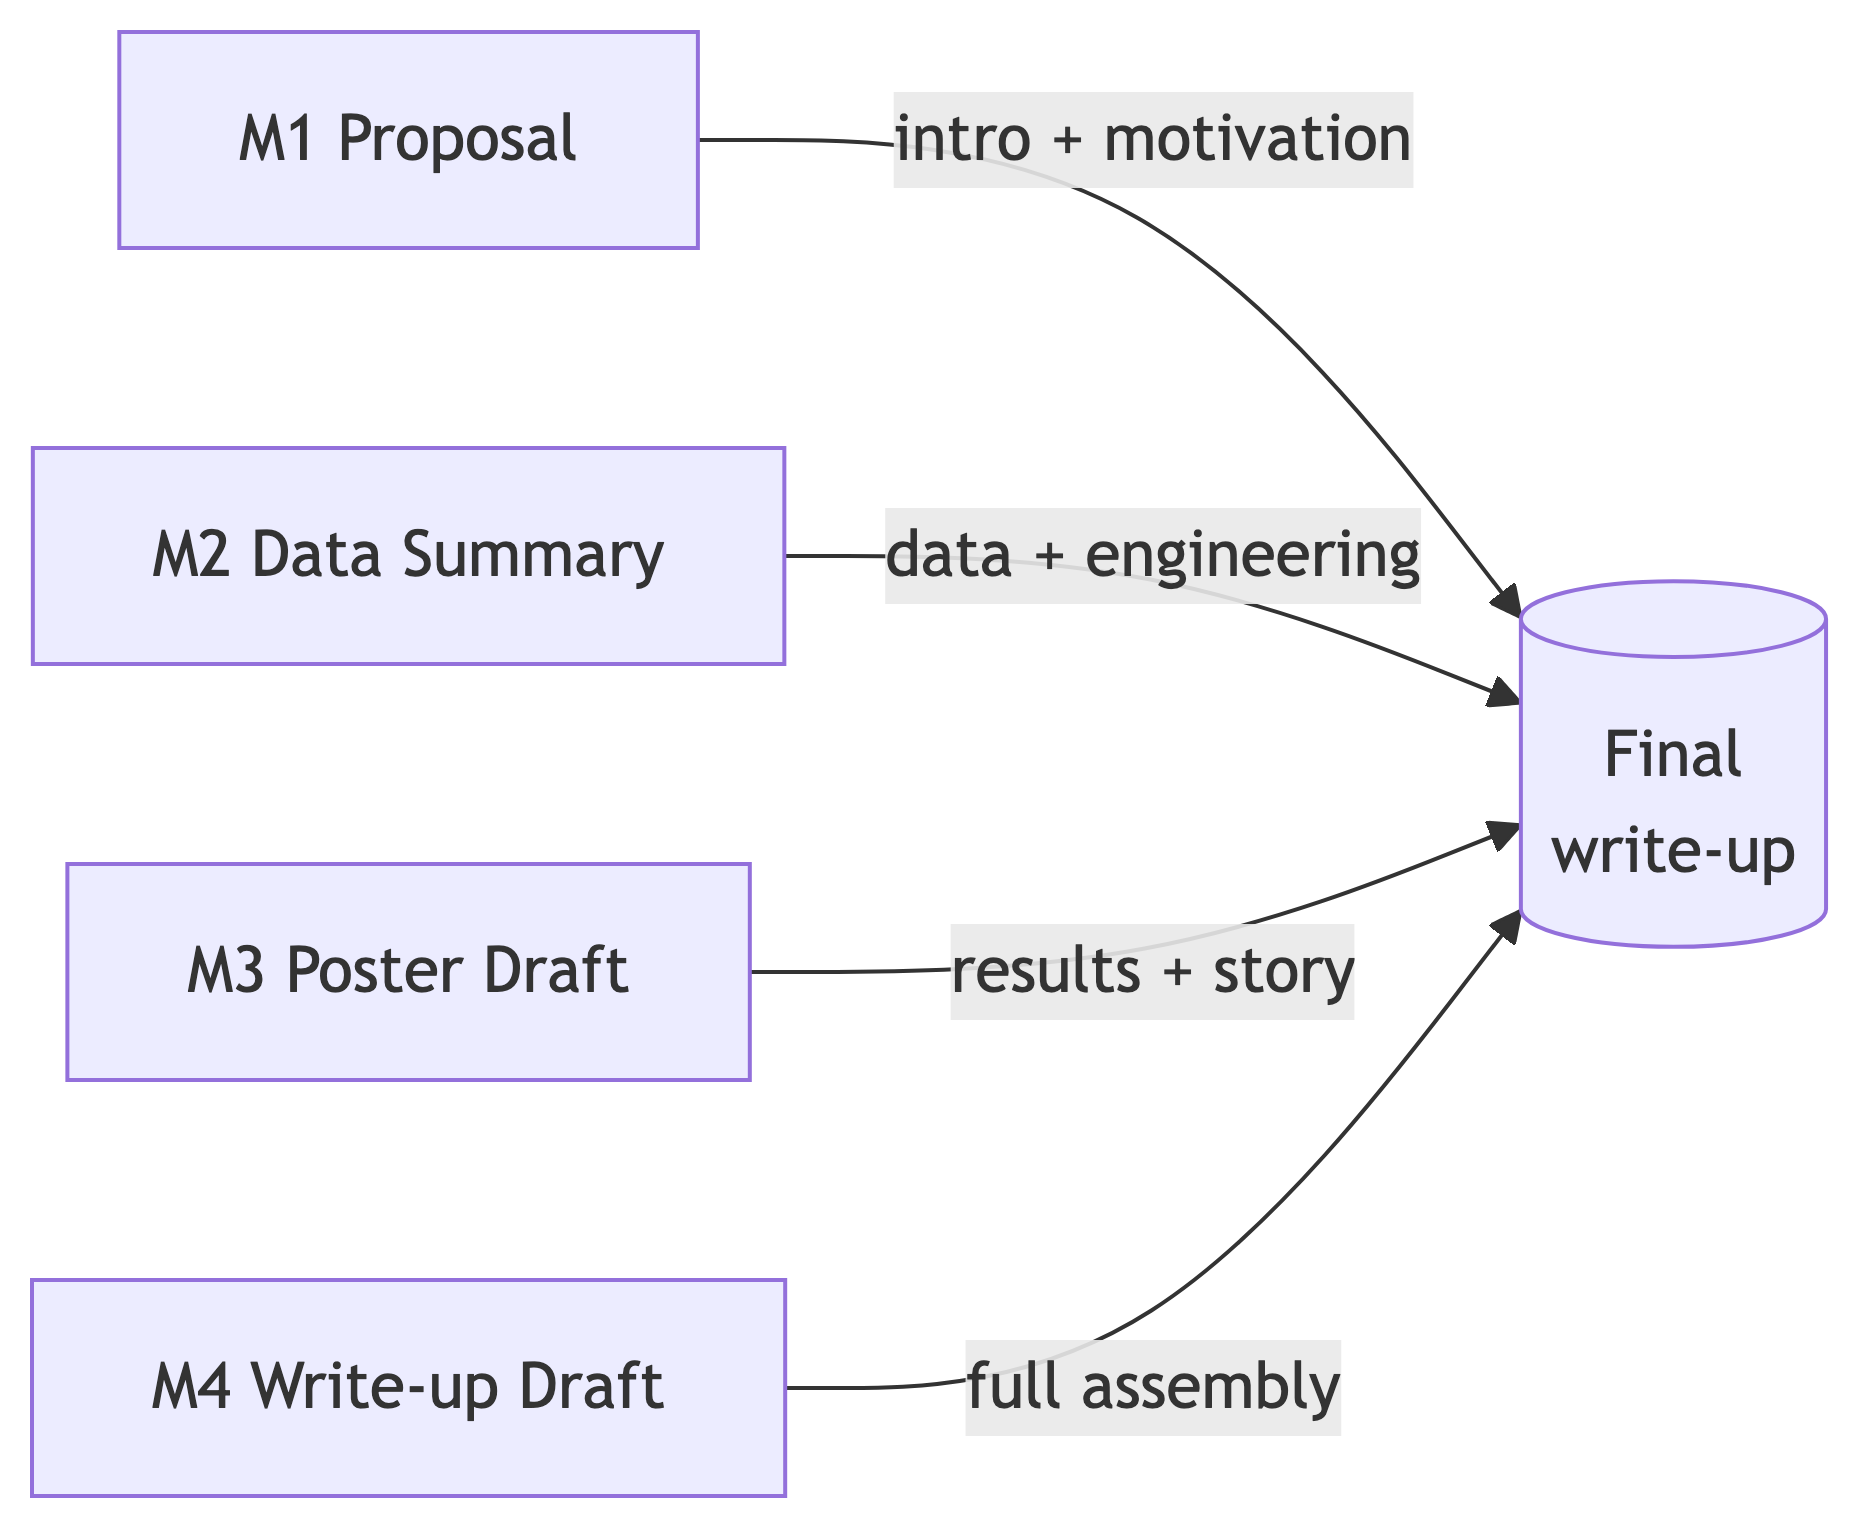
By M4 you are assembling and polishing sections you already drafted, not staring at a blank page.
Proposal Feedback Is in Flight
A timing note: I am reading your proposals this week. My written feedback is coming back to you while you are already planning toward the Data Summary.

Do not wait for it before you start. This is an iterative process, and the proposal is your default fallback, not a fixed contract. Anything I flag can be folded into the Data Summary (M2): adjust scope, document the delta, and keep moving.
What the Data Summary Requires
The M2 deliverable is one document in deliverables/M2-data-summary/ that points to repo paths. Seven sections.
| # | Section | What it proves |
|---|---|---|
| 1 | Research question reminder | The data scope still answers the proposal’s question |
| 2 | Data inventory | Source, license, size, date range, refresh policy, repo location |
| 3 | Schema and organization | Keys, join paths, raw vs analysis-ready layers |
| 4 | Ingestion status | Manual pulls done, or a pipeline that runs without babysitting |
| 5 | Data quality and profiling | Missingness, duplicates, outliers, and what you did about them |
| 6 | Reproducibility | Commands to rebuild analysis-ready data; environment notes |
| 7 | Ethics and access controls | PII, consent, redaction, sharing constraints |
This is section 5 of your write-up (“Data and data engineering”) being born early. After M2, the work shifts from acquisition to analysis.
Iterations Are Sized to the Milestone
⚠️
Here is a change from a standard weekly cadence: an iteration is sized to the milestone it serves, not to a fixed week.
- A tight milestone like the Data Summary gets a short iteration.
- A long stretch like the run to the poster gets a longer iteration.
You plan the iteration to fit the milestone in front of you. The board and the Create / Observe / Analyze discipline stay the same; only the length changes.
Studios Run at Milestone Boundaries
Because iterations are milestone-sized, studios happen at milestone boundaries, not every single week. A single studio does all three rituals: review and critique, retrospective, then plan the next milestone.

Bookends |_ 📚 _|
Think of each studio as a bookend: it closes the milestone just finished and opens the next one.
Tonight is the exception: it is the first studio we are planning for, so there is nothing to review or retro yet, just planning for the Data Summary.
The next studio is the week 8 class, after the Data Summary is in. There you review, critique, retro, and plan what comes next.
🧠 Quick Quiz: What “Done” Means for M2
Which project has met the Data Summary bar?
A. "We found three great datasets and bookmarked them."
B. "Our scraper runs nightly, lands clean tables in data/processed/, and we documented the schema and row counts."
C. "We have all the raw files downloaded, about 40 of them, unsorted."
D. "We trained a first model and it looks promising."
B. M2 is about the data being in, organized, and self-sustaining, with enough documentation that I trust it. A is sources, not data. C is acquisition without organization. D jumps past the gate.
Part 2: Planning Tonight
A plan you do not write down is a wish. Here is the ritual that turns wishes into cards.

Planning Tonight
The Board Is Where Planning Lands
Every card moves across the same five columns. Planning means deciding which cards earn a spot in flight.

The columns are not job types. They are phases of one card: build it, measure it, decide what it means.
The Create / Observe / Analyze Triple
The triple is for data PBIs: (Product Backlog Items)cards that answer a question about your data. For the Data Summary, that means acquisition and profiling work.
| Phase | What you produce (M2 flavor) |
|---|---|
| Create | The artifact: an ingestion script, a cleaned table. Something exists in the repo. |
| Observe | Evidence about it: row counts, null rates, coverage, duplicates. A measurement is recorded. |
| Analyze | The data-quality decision: impute, flag, drop, re-pull, or accept. A next step is named. |
For M2, “Analyze” is not modeling. It is deciding what the profiling tells you to do about the data. Modeling and statistics come at M3 and later.
Not Every Card Is a Data PBI
Some cards are plain setup or infra: create the repo, add a .gitignore, invite peer POs to the board, wire up CI.
These have no meaningful Observe or Analyze, so do not force a triple onto them. Tag them infra, keep them on the board for visibility, and treat them as simple done / not-done.
| Card type | On the board | Needs a triple? |
|---|---|---|
| Data PBI (acquire, clean, profile) | Backlog -> Create -> Observe -> Analyze -> Done | Yes |
| Infra / task (setup, glue, admin) | Backlog -> Create -> Done | No, done / not-done |
This iteration, most of your meaningful cards are data PBIs (acquisition + profiling), with a few infra cards to stand up the plumbing.
The Definition of Ready (DoR)
A card should clear this bar before it moves into Create:
- A one-sentence hypothesis or user story (data PBIs)
- A named Create / Observe / Analyze triple (data PBIs; infra cards skip this)
- A milestone tag (this iteration, almost always
M2-data-summary, orinfra) - A size (S, M, L, XL)
Infra cards still need a tag and a size, just not a hypothesis or a triple. For a data PBI, if it cannot answer all of these, it stays in Backlog and we refine it.
Tags and Sizing
Milestone tags
Every card carries M1..M5, infra, or ethics. This iteration, lead with M2-data-summary.
Sizing for a milestone iteration
Size each card S to XL, then pull only what fits the length of this milestone’s iteration. The Data Summary runs two weeks (due end of week 7), so size cards to finish within that window.
[]!(assets/lucas-tshirt.png){style=“max-height: 200vh; width: auto;” fig-alt=“Lucas is wearing a t-shirt”}
Studio Sessions Tonight
Three sessions run back to back tonight. Find your project; peer stakeholders attend the two sessions other than their own.
Session 1
- Aaron
- Ben
- Brandon
- Dylan
- Emery
- Spencer and Amaya
- Summer, Jon, and Mike
Session 2
- Bradley
- Brooke
- Emily, Sophia, and Tiffany
- Luca
- Manish
- Mary
- Simon and Rohan
Session 3
- Addison and Shanti
- Aiyana
- Courtney and Seira
- Dane and Alex
- Jackson
- Sarah
- Serenna and Siera
Peer PO assignments and shared themes: Peer Stakeholder PO lookup.
Tonight: Your First Studio Session
This is the first studio of the term, so we keep it simple: planning only, 20 minutes per project. No critique tonight, because you already did that in your peer reviews of the proposal. The goal is one committed iteration plan aimed at the Data Summary.
This briefing is the setup. After it, each project gets its 20 minutes to plan with its peer POs at the table.
What Each Role Does Tonight
Tonight everything happens in the 20-minute meeting. Owners build the plan live; peer stakeholders give input live and file their written review afterward.
👥 Owner team (in the meeting)
- Open your board and backlog from the charter and draft a few candidate
M2cards. - Frame what your Data Summary needs next.
- Drive the session and commit the plan.
👤 👤 Peer stakeholders (live, then review)
- Nothing beforehand.
- Give live input on the iteration: requirements, questions, risks; help prioritize.
- Commit your written review to the repo (
studio/) afterward.
The 20-Minute Agenda
| Phase | Time | Who leads |
|---|---|---|
| Owner framing: project + M2 goal + candidate cards | 5 min | Owner team |
| Peer PO input on the iteration | 6 min | Peer POs |
| Backlog refinement and board walk | 7 min | Owner team, with peer PO input |
| Commit the iteration plan | 2 min | Owner team |
The planning happens in the board walk: refine the top of Backlog to Ready, then pull the cards you can realistically finish this iteration. You leave with a committed plan.
Example: A Studio in Action
Let me walk one studio with three borrowed faces. The names are for fun; the moves are the point.
- Sheldon, Owner Product Lead. His project forecasts weekly Pasadena bus ridership.
- Penny, peer stakeholder. She presses on who decides what.
- Howard, peer stakeholder. He presses on the data and the pipeline.
Tonight is only iteration planning for M2. There is no retrospective yet; we run the retrospective ritual before the next studio, once there is an iteration to look back on.
Example: Owner Framing and Peer Input
 Sheldon (owner, 5 min): “My project forecasts weekly ridership for Pasadena Transit. For the Data Summary I need every 2020 to 2024 ridership record pulled, profiled, and documented. Three candidate cards: pull the API, profile the nulls, document the schema.”
 Penny (peer, input): “Who actually uses this forecast, and to decide what? Say it as a user story.”
Sheldon: “As a Pasadena Transit planner, I need to know next month’s ridership by route, so that I can set bus frequency.”
 Howard (peer, input): “Does the API really cover 2020? Ridership cratered that year. If there are gaps, you decide impute versus flag before you call the data done, not after.”
Example: Board Walk and Commit
Sheldon (board walk, 7 min): refines the top card to Ready.
Hypothesis: The Pasadena Transit API covers 2020-2024 well enough to skip manual export.
Create:  Script pulling all 2020-2024 records into data/raw/ridership/.
Observe: Records per year vs the agency's published totals; flag any year off by >5%.
Analyze: Decide impute vs flag for low-coverage years.
Tag: M2-data-summary    Size: M
He is solo, so he keeps it small: he pulls the API card and the profiling card (both data PBIs) into Create, and defers the schema-doc card so he is not juggling too much at once.
Howard: “What about the data/processed/ folder and the .gitignore?” Sheldon: “That is an infra card, no triple, just done or not-done.”
Sheldon (commit, 2 min): writes the plan into README.md. After the table breaks, Penny and Howard each commit a short written review capturing what they raised. Done.
🏡 Where Planning Lives: Board and Repo
The board is “what is happening now.” The repo is “what happened, in writing.”
Tonight you commit the plan in README.md. After you execute, it fills out into a full Iteration Review (completed PBIs, observations, decisions) before the review studio.
Plan It: Write One M2 Card 🎯
Take three minutes. For your project, write one card aimed at the Data Summary, with all the Ready fields.
Worked example:
Hypothesis: The transit agency's API has enough coverage to skip the manual export.
Create:  A Python script that pulls all 2020-2024 records into data/raw/ridership/.
Observe: Count records per year; compare totals to the published annual figures.
Analyze: If coverage is within 5%, drop the manual export card. If not, keep it.
Tag: M2-data-summary    Size: M
Part 3: The Data Story 📚
The Data Summary is not the end of a chore. It is the foundation of the only thing your audience will remember: the story.
The Data Story
Start It Now, Not at the Poster
Most teams wait until the poster to think about narrative. By then the data is already collected and the story has to be reverse-engineered out of whatever they happened to gather.
Do it backwards on purpose: let the story you want to tell shape which data you prove you have at M2. The Data Summary and the data story are the same decision viewed from two ends.
A Data Story Is a User Story
You know this shape from agile. A user story is told from the point of view of the person who needs something:
A data story is the same move for analytics, told from the stakeholder who needs the answer, not the analyst who runs the model:
That is why DS3 lets every PBI be a hypothesis or a user story. Your project is the biggest user story you have; your backlog items ladder up to it.
The Story Spine 🦴
Fill in five blanks and you have a spine.
| Beat | Prompt |
|---|---|
| Context | “For [audience], in a world where [situation]…” |
| Tension | “…there is a problem: [the gap or pain].” |
| Question | “So we asked: [your research question].” |
| Finding | “Using [your data], we found [the insight].” |
| Stakes | “Which means [the implication / what should change].” |
You cannot fill the Finding beat honestly until your data is in. That is the link back to your M2 gate.
The Write-Up Skeleton
The spine is the soul; the skeleton is the body it lives in. Every poster and write-up addresses these components. Stub this file in deliverables/ and grow it.
# <Project Title>
Team, affiliations

## Abstract
## Introduction: problem and research question(s)
## Impact and stakeholders
## Related work / background
## Data and data engineering
## Ethics and responsible use
## Methods and evaluation
## Results and visualizations
## Discussion, limitations, and future work
## Conclusions and recommendations
## Reproducibility and references
Your project may rename, merge, or add sections, but every write-up addresses these. Start from a .qmd so one source renders to HTML and PDF.
Which Milestone Fills Which Section ⁉️
Each milestone first-drafts specific sections of that skeleton.
| Write-up section | First drafted at |
|---|---|
| Introduction, problem, research question | M1 Proposal |
| Impact and stakeholders | M1 Proposal |
| Data and data engineering | M2 Data Summary |
| Ethics and responsible use | M1, deepened at M2 |
| Methods and evaluation | M3 Poster Draft |
| Results and visualizations | M3 Poster Draft |
| Discussion, limitations, future work | M4 Write-up Draft |
| Conclusions and recommendations | M4 Write-up Draft |
| Reproducibility and references | M2, maintained throughout |
You already wrote two of these at M1. This week you write the next one. M4 is assembly, not authorship from scratch.
Wrap 🎁
Tonight and the Next Two Weeks
What I Want From You
Tonight, in your 20-minute planning studio:
- Plan the iteration: Ready,
M2-tagged cards on the board, sized to fit the two-week iteration. - Commit the plan in
README.mdbefore the table breaks.
Over the next two weeks, toward the Data Summary:
- Incorporate proposal feedback from me and your peer POs into your plan and the Data Summary.
- Acquire and organize: real data landing in
data/processed/. - Stub the skeleton and outline your data story.
- Submit the Data Summary by end of week 7, then post your Iteration Review in
README.mdbefore the week 8 studio.
References
- Saltz, J. S., Hotz, N., and Sutherland, A. (2022). Achieving Lean Data Science Agility Via Data Driven Scrum. HICSS 55. https://hdl.handle.net/10125/80218
- Data Science Process Alliance. Data Driven Scrum. https://www.datascience-pm.com/data-driven-scrum/
- Schwaber, K., and Sutherland, J. The Scrum Guide. https://scrumguides.org/
- Anderson, D. J., and Carmichael, A. The Kanban Guide. https://kanbanguide.org/
- Knaflic, C. N. (2015). Storytelling with Data. Wiley.
- Duarte, N. (2019). DataStory: Explain Data and Inspire Action Through Story. Ideapress Publishing.
- DATA 510 Data Summary (M2) milestone brief. https://courses.lpcordova.phd/data510/project/data-summary.html
- DATA 510 Project requirements at a glance. https://courses.lpcordova.phd/data510/project/project-requirements.html
- DATA 510 Studio Session (DS3 ritual).